Growth of Saguaros at Tohono Chul Park
Written by Paul (Mac) Consigny, Cohort 2
Background.
In 1999, a team of Tohono Chul volunteers, the Saguaro Huggers, began measuring the height of the main stem of specific saguaros within Tohono Chul Park. A total of 251 saguaros were measured for the first time between 1999 and 2001. By 2018, the heights of 186 of these saguaros were still being measured.
Part 1. The effect of height on saguaro growth.
In 2019, the growth rate of each of these 186 saguaros was determined using Excel’s linear regression function and graphics as depicted in the figure below for Saguaro G006. The slope of the blue dashed line is the growth rate (mm/day or mm/year). The mean height was calculated according to the equation:
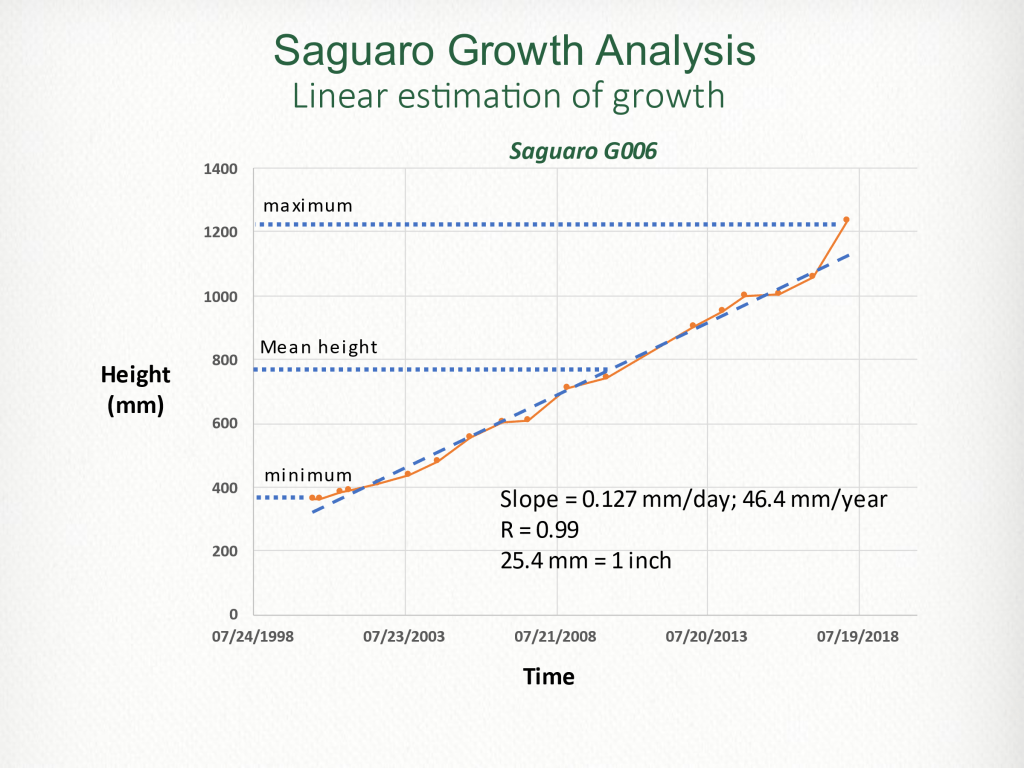
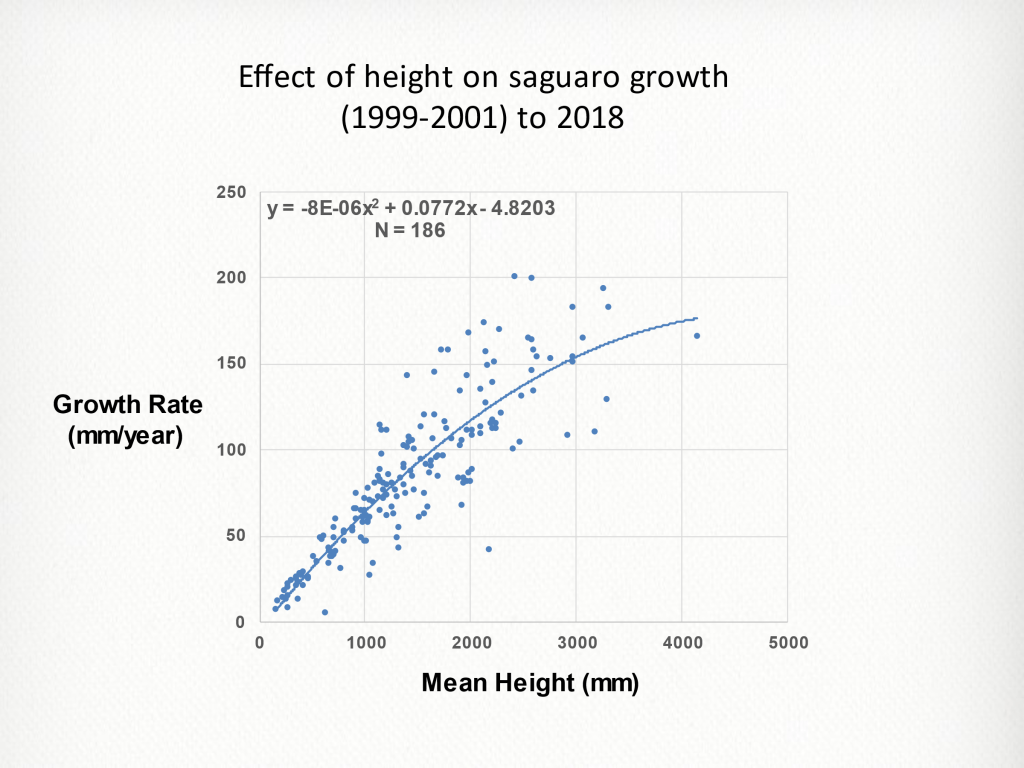
The figure demonstrates that saguaro annual growth rate is directly related to mean saguaro height. The increase in data scatter as mean height increases and a bending of the curve suggests that other variable besides height come into play. Those variables could include: arm development; injuries from freezing, insects, bird holes etc.; variations in weather including precipitation, temperature, evapotranspiration, etc.
Part 2. The effect of weather on the growth rate of fast-growing saguaros.
A second study, based on the first saguaro growth study above, was focused on the effects of weather on saguaro growth. To reduce the variability in the data, we restricted this analysis to the fastest growing saguaros. This restriction was based upon the hypothesis that the fastest growing saguaros would be more sensitive to the effects of weather than the slowest growing saguaros.
Eleven saguaros were chosen for this study. The average height of these saguaros ranged from 1139.5 mm to 2581.0 mm and the growth rates ranged from 111.2 mm/year to 200.6 mm/year.
A. Effect of precipitation on fast-growing saguaros.
For our analyses of weather, we chose to use data for the Tohono Chul location obtained from the Climate Engine database (ClimateEngine.com).
Precipitation at Tohono Chul occurs annually over two seasons, the summer monsoon, and the winter season. We first needed to define the duration of each season (start and end days). For this definition, we first calculated the average daily precipitation for each day of the year for the years 1999 through 2018. This analysis revealed that minimum precipitation for these years occurred June 8/9 and Nov 17/18. Having identified these minimums, we created the following definitions of precipitation:
- Summer precipitation is the cumulative precipitation from June 9 (day 160) through Nov 17 (day 321).
- Winter precipitation is the cumulative precipitation from Nov 18 (day 322) of the previous year through June 8 (day 159) of the current year.
- Calendar year precipitation (CYP) is the cumulative precipitation over the calendar year.
- Precipitation year precipitation (PYP) is the cumulative precipitation from Nov 18 (day 322) of the previous year through Nov 17 (day 321) of the current year.
- Monsoon precipitation is the cumulative precipitation for the months of July, August, and September, the time over which saguaro apical growth is reported to occur. (JR Hastings 1961)
We determined the correlations between annual growth and summer, winter, monsoon, CYP, and PYP for the 11 fast-growing saguaros. The results of these analyses are summarized in the table below.
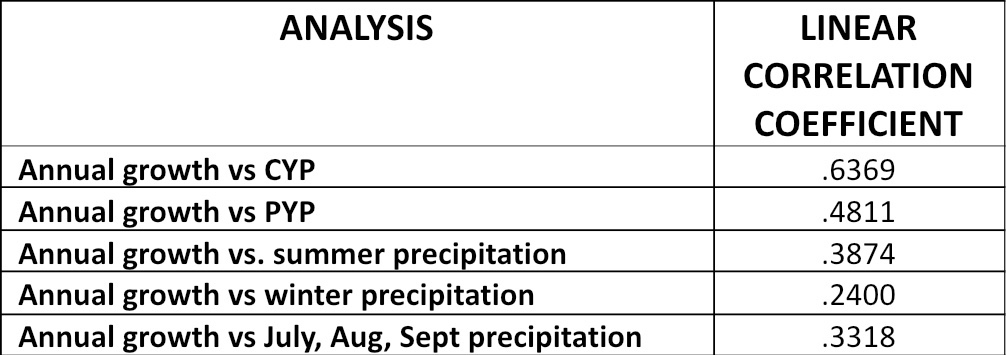
A correlation coefficient greater than 0.205 is considered statistically significant (p<.05; N = 92). Therefore, all correlations in the table are statistically significant. Also, the closer the correlation is to 1.0, the stronger the correlation.
The linear relationship with the highest correlation, annual growth vs CYP, is depicted in the graph below.

B. Effect of evapotranspiration on annual growth.
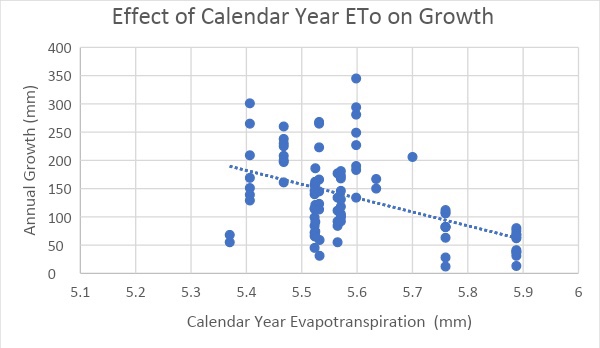
Another factor that could influence saguaro growth is evapotranspiration, the process by which water is transferred from the land and other surfaces to the atmosphere by evaporation and by transpiration from plants. We obtained evapotranspiration data for the Tohono Chul location from the Climate Engine (https://ClimateEngine.com). The data was expressed as a reference ETo – the estimated evapotranspiration from a well-watered, full-cover grass surface, 8-15 cm in height. Factors that influence evapotranspiration include surface water (area, depth, temperature), atmospheric temperature and humidity, topography, and vegetation.
We determined the correlation between calendar year ETo and saguaro annual growth for the 11 fast-growing saguaros. The correlation coefficient was 0.4746 (P < 0.001) with a negative slope suggesting that as ETo increases annual growth decreases.
C. Effect of precipitation and evapotranspiration on fast growing growth.
Since both precipitation and evapotranspiration affect plant growth, we combined these two variables into a ratio (calendar year evapotranspiration /calendar year precipitation) where we expected that growth would increase as this ratio decreased. The linear correlation is depicted below.
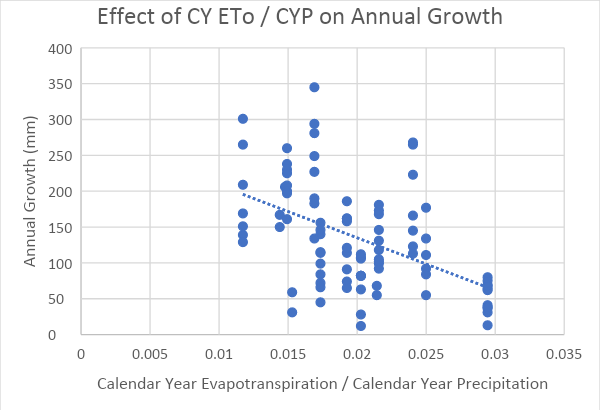
Note that the correlation between annual growth and the CY ETo / CYP ratio (0.4976) was less than the correlation between CYP and annual growth (0.6369) suggesting that the addition of ETo as a variable failed to improve the correlation.
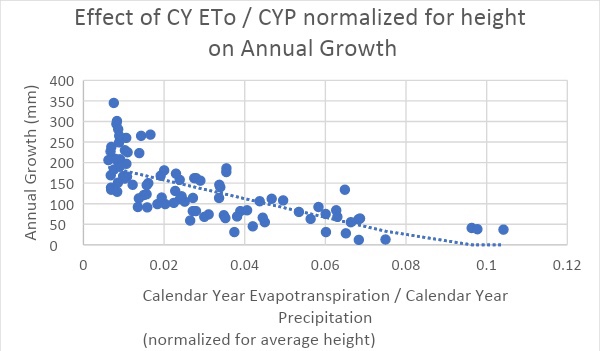
The scatter in the graph above suggested that another variable or variables should be included in the analysis. Since our first study demonstrated that growth rate is directly related to average height, we normalized / adjusted the data to correct for average height differences. The graph below shows the linear relationship between CY ETo / CYP and annual growth after correction for height.
The graph below shows the curvilinear (exponential) relationship between CY ETo / CYP and annual growth.

All three of the above graphs demonstrate that as numerator calendar year ETo increases and / or the denominator calendar year precipitation decreases, annual growth decreases. Correcting for differences in saguaro height reduces data scatter and improves the correlation coefficient (0.4976 to 0.7113). Fitting an exponential relationship to the height-corrected data further improves the correlation coefficient (0.7113 to 0.7633).
D. Summary of Results:
- Annual saguaro growth is directly related to average saguaro height.
- Saguaro growth is directly correlated to precipitation (P<0.001) as measured by CYP, PYP, and winter, summer, and July-August-September / monsoon precipitation. Calendar year precipitation was the most predictive measure of saguaro annual growth (r = .6369).
- Saguaro growth is directly correlated to calendar year evapotranspiration (r = 0.4746).
- Annual saguaro growth is inversely related to CY ETo / CYP (r = 0.4976).
- Correcting for differences in average height reduced data scatter and improved the correlation between CY ETo / CYP and annual saguaro growth (0.4976 to 0.7113)
- Fitting an exponential curve to the data further improved the correlation coefficient between CY ETo / CYP and annual saguaro growth (0.7113 to 0.7633).
E. Conclusion:
The results of this study demonstrate that multiple factors affect the annual growth of saguaros. These factors include average saguaro height, precipitation, evapotranspiration (factors that contribute to evaporation including soil moisture atmospheric temperature and humidity, and topography, and factors that contribute to transpiration including saguaro surface area, density of stomata, opening of stomata, and timing of the opening of the stomata). Other possible factors not analyzed include sources of water other than precipitation, presence/absence of nurse plants, presence and number of arms, and presence/absence/magnitude of disease or injury.

You must be logged in to post a comment.